Matplotlib Line with dates
examples/matplotlib/line_with_dates.py
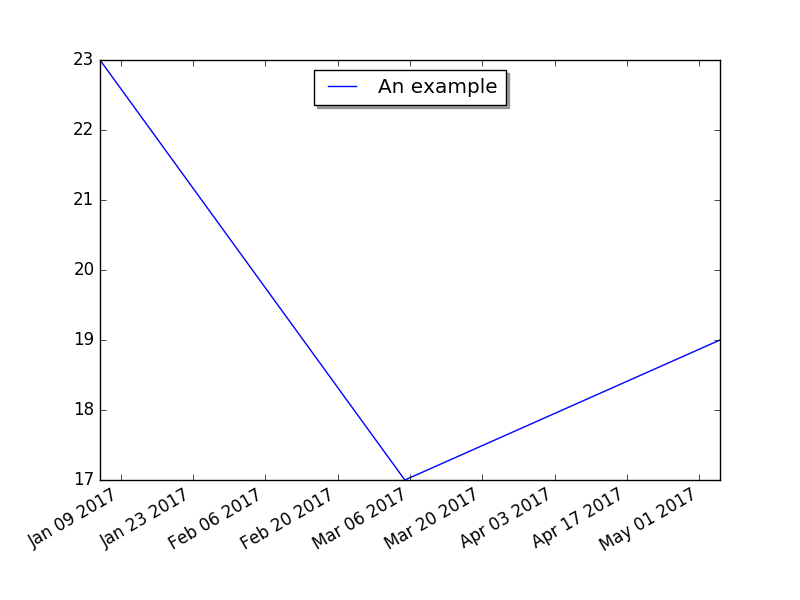
import datetime
import matplotlib.pyplot as plt

fig, subplots = plt.subplots()
subplots.plot(
    [datetime.date(2017, 1, 5), datetime.date(2017, 3, 5), datetime.date(2017, 5, 5)],
    [ 23, 17, 19 ],
    label='An example',
)
subplots.legend(loc='upper center', shadow=True)
fig.autofmt_xdate()
plt.show()
#plt.savefig('line_with_dates.png')