Pandas Show histogram
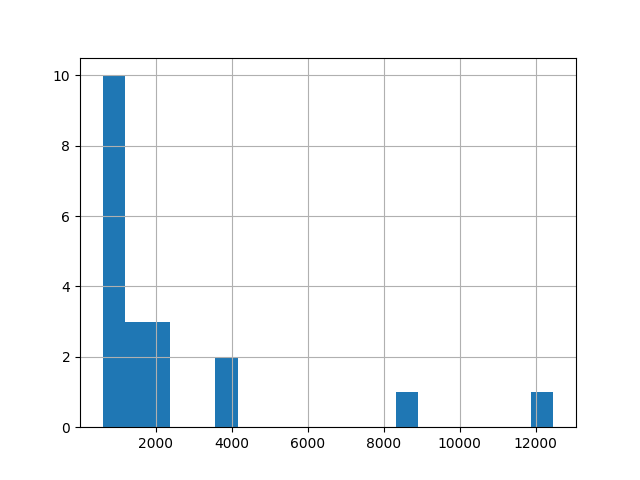
examples/pandas/so_histogram.py
import sys
import pandas as pd
import matplotlib.pyplot as plt

filename = "survey_results_public.csv"
if len(sys.argv) == 2:
    filename = sys.argv[1]

df = pd.read_csv(filename)

country_count = df['Country'].value_counts()

N = 20
# Take the top N countries
first = country_count.head(N)

# Historgram of the top 20 countries
hist = first.hist(bins = N)

plt.show(block=hist)
#plt.savefig('so_histogram.png')