We have already seen 5 levels of logging in JavaScript. Each one showed the line number where the function was called. That's very nice, but if the same function can be called in multiple places then having that context can improve your understand what has happened.
Printing a full stack trace can help a lot.
Using console.trace
Luckily the console object also has a method called trace.
In the following example we have a few totally useless functions calling each other and then
calling the add function, that calls console.trace.
examples/javascript/logging/logging_trace.js
function add(x, y) {
    console.trace('add called with ', x, 'and', y);
    return x+y;
}

function calc() {
    return add(8, 11) + add(9, 14);
}

function main() {
    var x = add(2, 3);
    var y = calc();
}


main();
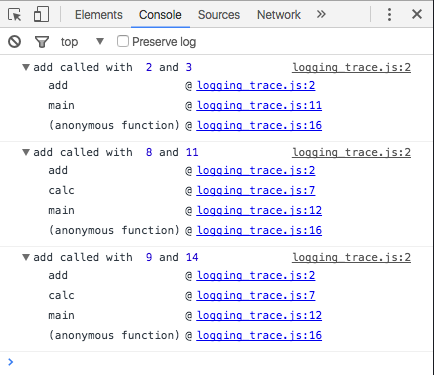
The output in the JavaScript web console of Chrome looks like this:
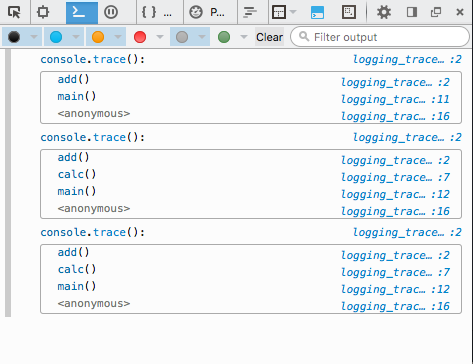
In Firefox it looks like this:
If you'd like to try it yourself, here is the HTML that will load the above JavaScript file.
examples/javascript/logging/logging_trace.html
<!DOCTYPE html>
<html lang="en">
<head>
  <meta charset="utf-8">
  <script src="logging_trace.js"></script>
</head>
<body>
    <a href="http://code-maven.com/open-javascript-console" target="_blank">Open the JavaScript console</a>
    in order to see the logging messages.
</body>
</html>
Stack trace as a string
There are cases when you might not necessarily want to print the stacktrace immediately, or you might even want to save it or send it to the server. For such cases, it would be nice to be able to get a string version of the stack trace.
The following solutions are based on ideas found on this and this page.
Stack trace with Error object
In this solution we create and Error object and then return (and print)
the stack attribute.
The full JavaScript code looks like this:
examples/javascript/logging/logging_trace_with_error.js
function add(x, y) {
    console.log(new Error().stack);
    return x+y;
}

function calc() {
    return add(8, 11) + add(9, 14);
}

function main() {
    var x = add(2, 3);
    var y = calc();
}


main();
The corresponding HTML file is not very intersting, but it is included to make it easier for you to try it: examples/javascript/logging/logging_trace_with_error.html
<!DOCTYPE html>
<html lang="en">
<head>
  <meta charset="utf-8">
  <script src="logging_trace_with_error.js"></script>
</head>
<body>
    <a href="http://code-maven.com/open-javascript-console" target="_blank">Open the JavaScript console</a>
    in order to see the logging messages.
</body>
</html>
The output in Chrome:

and in FireFox:

Stack trace using caller object
In this solution we have implemented a function called stacktrace
that will return a string representing the call history to the point
where stacktrace() was called.
Internally it uses another function called st2 that will be called
recursively traversing the call-tree up till the point where we reach the main
body of our JavaScript script.
examples/javascript/logging/logging_stacktrace.js
function add(x, y) {
    console.log(stacktrace());
    return x+y;
}

function calc() {
    return add(8, 11) + add(9, 14);
}

function main() {
    var x = add(2, 3);
    var y = calc();
}


main();

function stacktrace() {
  function st2(f) {
    var args = [];
    if (f) {
        for (var i = 0; i < f.arguments.length; i++) {
            args.push(f.arguments[i]);
        }
        var function_name = f.toString().split('(')[0].substring(9);
        return st2(f.caller) + function_name + '(' + args.join(', ') + ')' + "\n";
    } else {
        return "";
    }
  }
  return st2(arguments.callee.caller);
}
At the end of the declaration of stacktrace we call st2
with the arguments.callee.caller.
arguments is
a special object that belongs to the current function call and that contains a lot of
information about the current call. For example the callee attribute refers to the
currently executing function which is stacktrace.
We can probably replace return st2(arguments.callee.caller);
by return st2(stacktrace.caller);, but then we repeat the function name which
will make it harder to rename the function.
the st2 function is then called recursively and it returns the stacktrace string so far.
When it reaches the top-most function call (in our case main) the next recursive call
will be with an undefined value received from f.caller. That will make it
return an empty string without further recursive calls.
If f is not yet undefined we build up the current call at the current
level of the stacktrace.
We use the arguments
object of the current function. Because it is not a real Array we cannot use join and we have to
loop over the elements to build up the list of arguments received by this call. That's what is saved
in the args array.
f.toString() returns the string representation of the function f.
Each such string representation starts with function some_name(param, param) {.
split('(') cuts that string at the ( characters in the source code of
the function, including the first ( in the argument declaration.
The [0] means we take the first element from the returned array. That returns
function some_name. Calling substring(9) take all the characters
except the first 9 and returns that string. The returned string is the name of the
function. In our example it is some_name. That's how we can extract the name
of the currently called function.
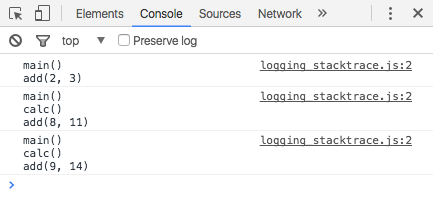
Now that we have both the name of the current function and the list of parameters it received we can create a string that represents the call.
The result looks like this in Chrome:
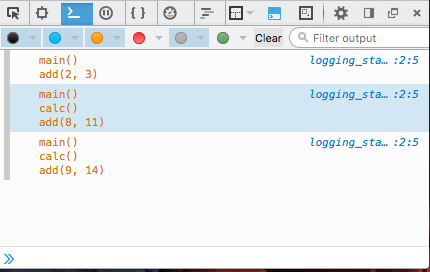
and this in FireFox:
If you'd like to try it yourself, here is the corresponding html file: examples/javascript/logging/logging_stacktrace.html
<!DOCTYPE html>
<html lang="en">
<head>
  <meta charset="utf-8">
  <script src="logging_stacktrace.js"></script>
</head>
<body>
    <a href="http://code-maven.com/open-javascript-console" target="_blank">Open the JavaScript console</a>
    in order to see the logging messages.
</body>
</html>
The console API
For even further details check out the console API of Chrome and the console API of FireFox.
Comments
As far as I understand, "Stack trace using caller object" part doesn't work in modern browsers, after arguments.callee.caller deprecation, right?
Thanks. It works well in Flash too!
